By the end of 2021, the Canadian economy had returned to pre-pandemic levels for most major economic indicators. Similarly, the economic indicators discussed in this post for BC had returned to, or even exceeded, levels from before the pandemic. In Q1 of 2022, all economic indicators for Canada and BC exceeded pre-pandemic levels except for BC’s unemployment rate, which is forecast to return below pre-pandemic levels during the remaining quarters of 2022.
In Q1, BC lifted the majority of COVID-19 restrictions. By the end of the quarter more than 85% of the population five years-old and older had received one COVID-19 vaccine dose, more than 81% had received two doses, and 47% had received both doses and a booster shot.
Russia’s invasion of Ukraine in February 2022 resulted in increased economic uncertainty due to shocks to energy, food, and other commodity prices. TD Economics (TDE) considers the impact of these shocks to be the biggest factor in their Q1 outlook.
This article gives readers an update from Q4 2021 to Q1 2022 of selected economic indicators. The indicators discussed herein are both indicative and representative of the Canadian, BC, and regional economies.
Labour Market
The labour force refers to the supply (employees) and demand (employers) for labour. The number of labour force participants and the unemployment rate are indicators that highlight the material changes that took place in the labour market from Q4 2021 to Q1 2022.
COVID-19 Government Programs
At the end of Q4 the Government extended the Canada Recovery Hiring Program (CRHP) and the Canada Recovery Sickness Benefit (CRSB) to May 7, 2022 (Link 2). Nevertheless, businesses may apply to these programs up to 180 days after the end of their claim period.
Labour Force
The federal government initiated several programs to support employers and employees impacted by COVID-19. On October 24, 2021, the Tourism and Hospitality Recovery Program and the Hardest-Hit Recovery Program replaced the Canada Emergency Wage Subsidy (CEWS) and the Canada Emergency Rent Subsidy (CERS).
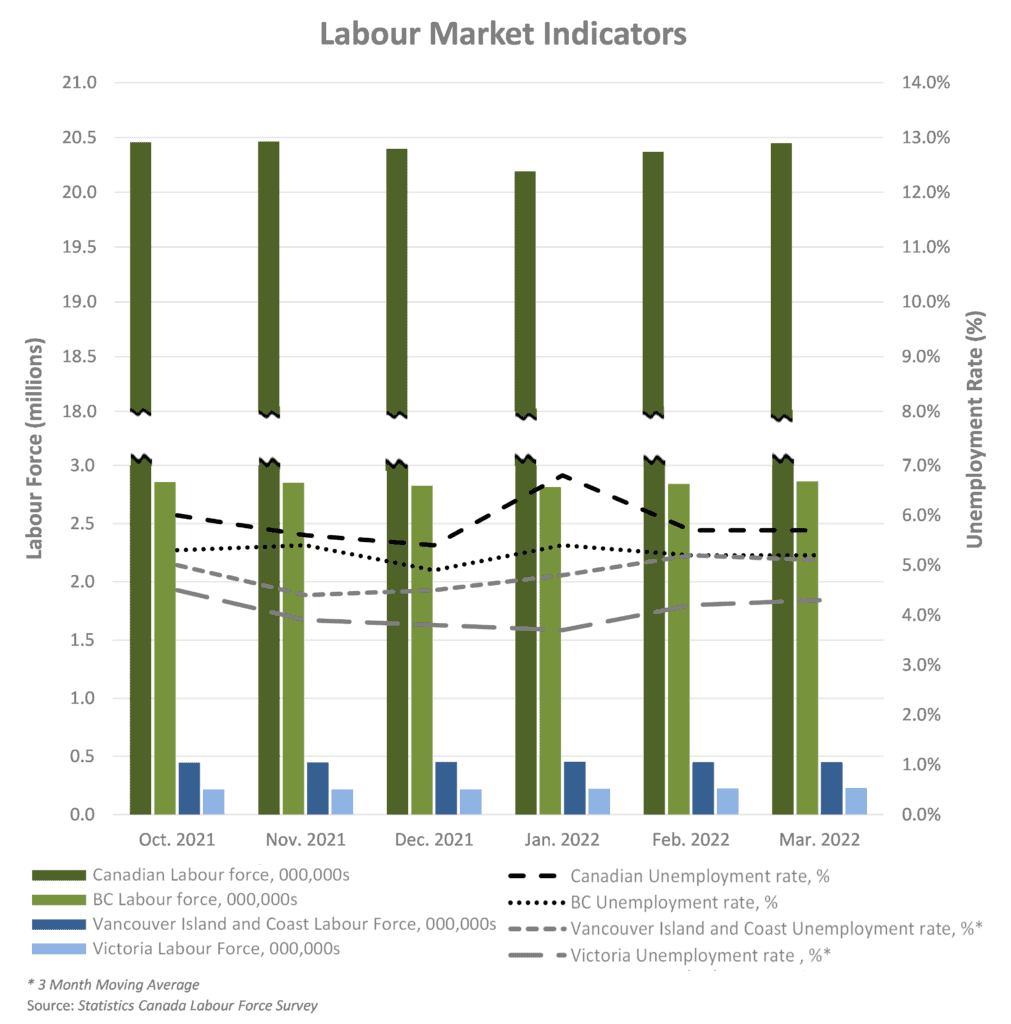
Before the impact of COVID-19, Canada experienced a steady increase in labour force participants. As of March 31, 2022, the Canadian labour force consisted of 20.4 million people, an increase of approximately 51,000 participants since the prior quarter and above 20.0 million in the labour force prior to COVID-19.
Unemployment
The national unemployment rate was 5.4 % at the start of Q1 and increased to 5.7% by the end of the quarter which is 0.2% lower than the pre-pandemic rate of 5.9%. TD Economics forecast that Canada’s unemployment will decrease further to 5.4% in 2022 and remain around that rate through 2023.
BC’s unemployment rate reflected the national trend, increasing from 4.9% to 5.2% during Q1. The quarter closing rate was 0.2% higher than the province’s February 2020 rate of 5.0%. As of December 2021 (the latest available data) BC’s job vacancy rate was the highest among the provinces due to a strong economic recovery that resulted in labour shortages. As a result, TDE forecast a decrease in BC’s unemployment rate to 4.6% for 2022.
The unemployment rate for Vancouver Island and Coastal regions also increased over Q1 from 4.5% to 5.1%, which was 0.2% lower than pre-pandemic rates. In Victoria, the unemployment rate increased throughout the quarter from 3.8% to 4.3%, which was 0.8% higher than the pre-pandemic rate of 3.5%.
Gross Domestic Product (GDP)
As posted in our prior update, TDE previously forecast Canada’s real GDP to grow by 4.4% for 2022. In Q1, TDE revised its 2022 GDP growth to 3.9%, a decrease of 0.5% due in part to shocks in commodity prices due to supply restraints and the Ukraine war. TDE forecasts a further slowing of the national GDP growth rate to 3.0% for 2023.
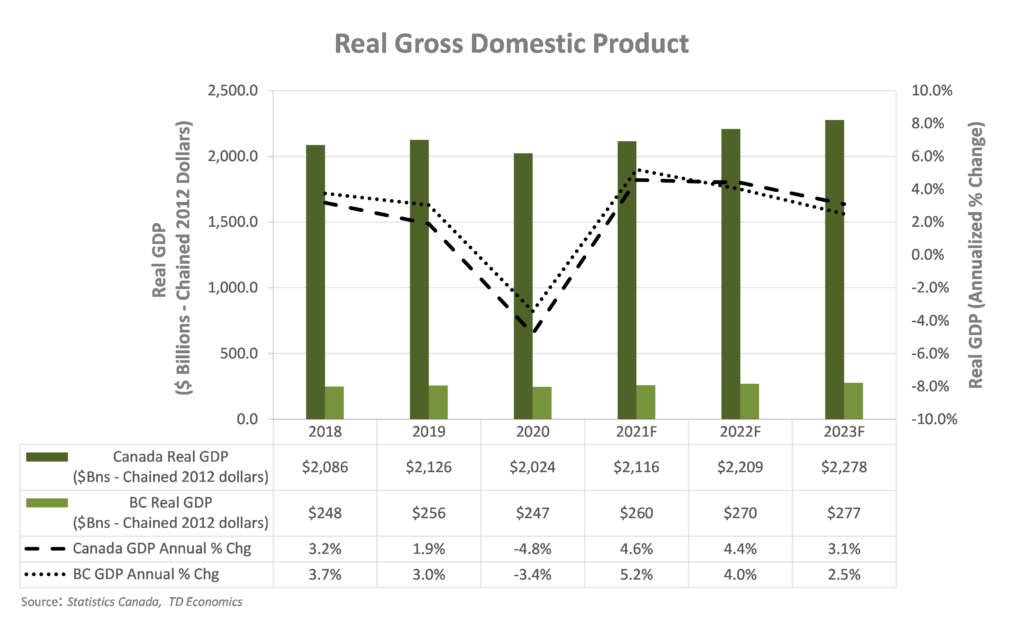
TDE forecasts slower growth for the BC economy of 3.8% for 2022 which is 0.4% lower than the forecast from the previous quarter (Q4 2021). The resulting forecast for BC’s GDP is $272 billion, $10 billion higher than 2021 and above pre-pandemic levels.
Housing Market
Housing starts and average residential prices reflect market indicators with strong correlation to both the construction and real estate industries. BC’s housing starts increased by 26.4% during 2021, reversing months of consecutive declines. The BC Real Estate Association (BCREA) forecasts a decrease of 11.7% for 2022 followed by a further decrease of 10.9% for 2023, because of expected impact on demand due to recent interest rate increases.
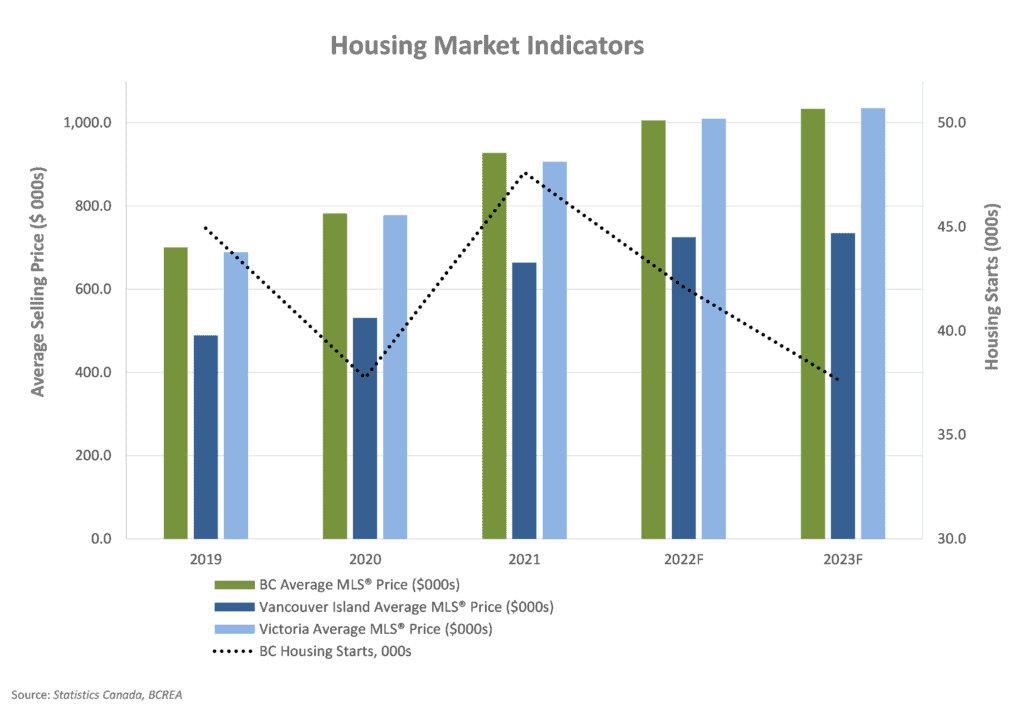
BCREA forecasts an increase of 8.5% in the average MLS® price for single family dwellings for 2022, with an average price of $1,006,000. This is notably larger than the prior quarter’s forecast for 2022, which predicted only a 2.7% increase with an average price of $939,000. BCREA attributes the forecast increase to lowest level of supply (active listings) on record.
Notwithstanding, BCREA downgraded their MLS® price growth forecast for 2023 to 2.7%, resulting in an average sales price of $1,033,300. BCREA forecast an increase in the average MLS® prices for single family dwellings in the Victoria area of 11.4% for 2022 and 2.5% for 2023.
Interest Rates & Foreign Exchange
During Q1 2022, the Bank of Canada (BoC) increased the overnight target rate from the all-time low of 0.25% to 0.50%. TDE forecasts that the target rate will continue to rise through 2022 and 2023.
The rising overnight target rate resulted in an increase in the prime rate. The average prime rate for Q1 was 2.70%, a 0.25% increase from the prior quarter. The prime rate is likely to continue increasing in step with the target overnight rate.
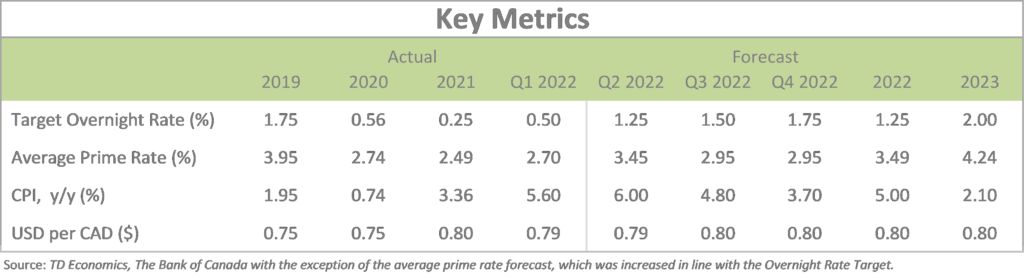
The BoC has stated that it will continue to increase policy rates to return inflation to the target of 2.00% (link 7) from its recent high of 5.6% for Q1 2022. There is expected to be some lag in this process and TDE forecasts inflation to be 5.0% for 2022, before returning to approximate the BoC’s target inflation rate by the end of 2023.
The Q1 2022 forecast for the average annual USD to CAD exchange rate for 2022 and 2023 of $0.80. This exchange rate strongly correlates to oil prices, and over the long-term the value of the Canadian dollar relative to the US dollar typically fluctuates in-step with oil price changes.
Crude Oil Prices
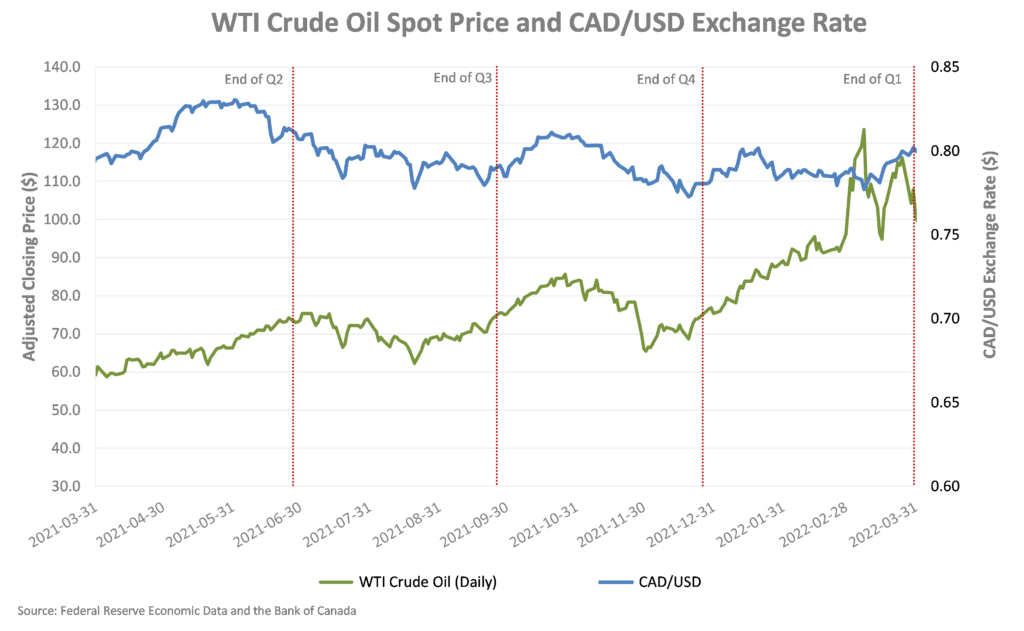
Canada has the 4th largest proven oil reserves in the world. As a net oil exporter, the Canadian economy is heavily impacted by the price of crude oil, with the greatest impact felt in Canada’s major oil producing provinces. The majority of Canadian crude oil production is in Alberta (81.0%), Saskatchewan (10.0%), and Newfoundland and Labrador (6.0%).
In North America, the West Texas Intermediate (WTI) crude oil spot price is the benchmark oil price. Historical WTI crude oil daily spot prices at the end of Q1 were:
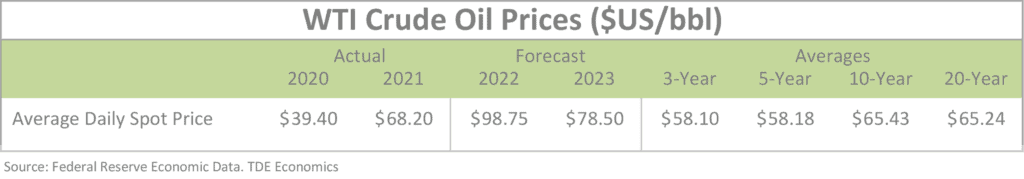
Over the course of Q1, WTI oil prices spiked from $75.99 (January 3) to $123.64 (March 8), which is higher than historical averages. The International Energy Agency (IEA) attributes the increase to international sanctions levied against Russia in response to its invasion of Ukraine. (link 11). TDE forecasts the WTI oil price to stay remain high at $98.75 per barrel for 2022 before decreasing to $78.50 for 2023.
Capital Markets
The international response to COVID-19 at the beginning of March 2020 negatively impacted the current and anticipated operations of many privately-owned and publicly traded North American businesses. For publicly traded companies, this impact is evident in changes in capital markets during the period. On March 12, 2020 both the Dow Jones Industrial Average (DJIA) and S&P/TSX Composite Index witnessed the greatest single-day percentage drop since the stock market crashes of 1943 and 1987, respectively. By the start of 2021 both indices had recovered to their pre-COVID-19 levels, and as of September 30, 2021, the year-to-date percentage gain for the Dow Jones Industrial Average (DJIA) and S&P/TSX Composite index was 20.4%. Both indices reached record all-time highs in Q4.
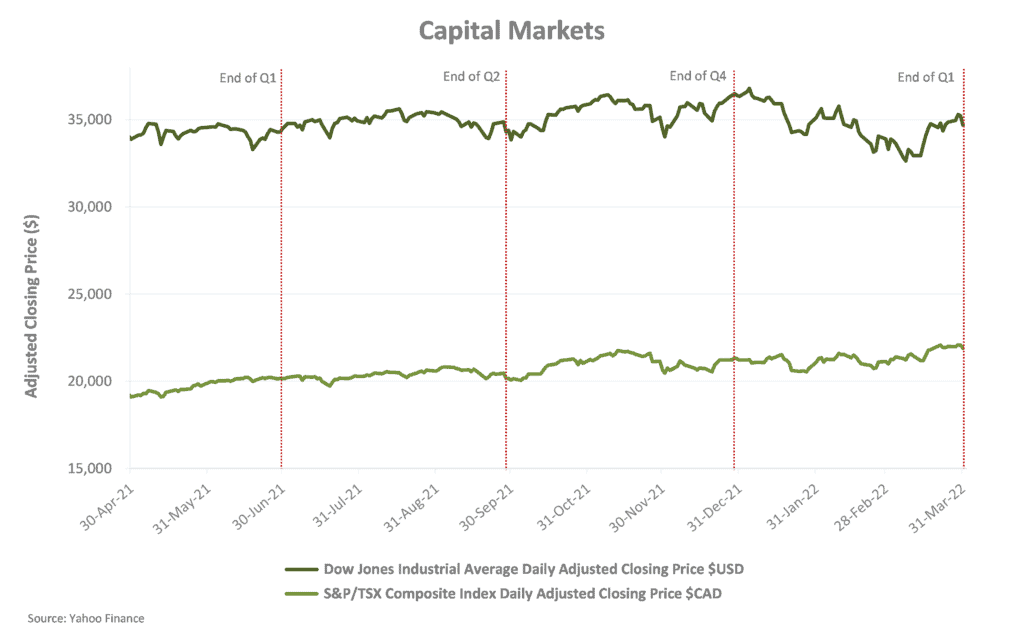
More recently, both the DJIA and S&P/TSX Composite indices reached all-time highs in Q1 2022, $36,800 (USD) on January 4, 2022 and $22,087 (CAD) on March 29, 2022, respectively. The year-to-date gain (loss) for both indices were -5.2% and 3.1%, respectfully. It is important to note that these indicators are based on forward looking assumptions and analysis.
Moving into second quarter of 2022, input prices for businesses are expected to remain high due to supply constraints and the impact of the Ukraine war and cost of labour is expected to remain elevated due to continued job vacancy rates. (Link 13) COVID-19 restrictions are expected to remain lifted and vaccination rates to increase, especially with the introduction of a second booster shot.
Business owners may still be able to benefit from the fiscal stimulus provided by various levels of government, but higher input prices and labour costs may stifle profit margins; however, energy, commodity, and food producing sectors could stand to benefit from higher prices. Interest rates are expected to increase further, so business owners may want to refrain from refinancing existing interest-bearing debt at the current elevated rates.
A glossary of all defined terms can be found here.
[1] In 1977, the TSE 300 index was created, comprising of the 300 largest companies on the TSX. In 2002, Standard and Poor’s took responsibility of the index and renamed it the “S&P/TSX Composite Index”.